
CloudDash Predictive Maintenance Cloud Dashboard Software
AI-driven insights, smart sensors, and expert guidance to keep your critical assets running at peak performance.

Key Metrics
Monitoring Uptime
24/7
Continuous machine monitoring and alert system
Amount of sensors up at a time
999+
Synchronised Sensors
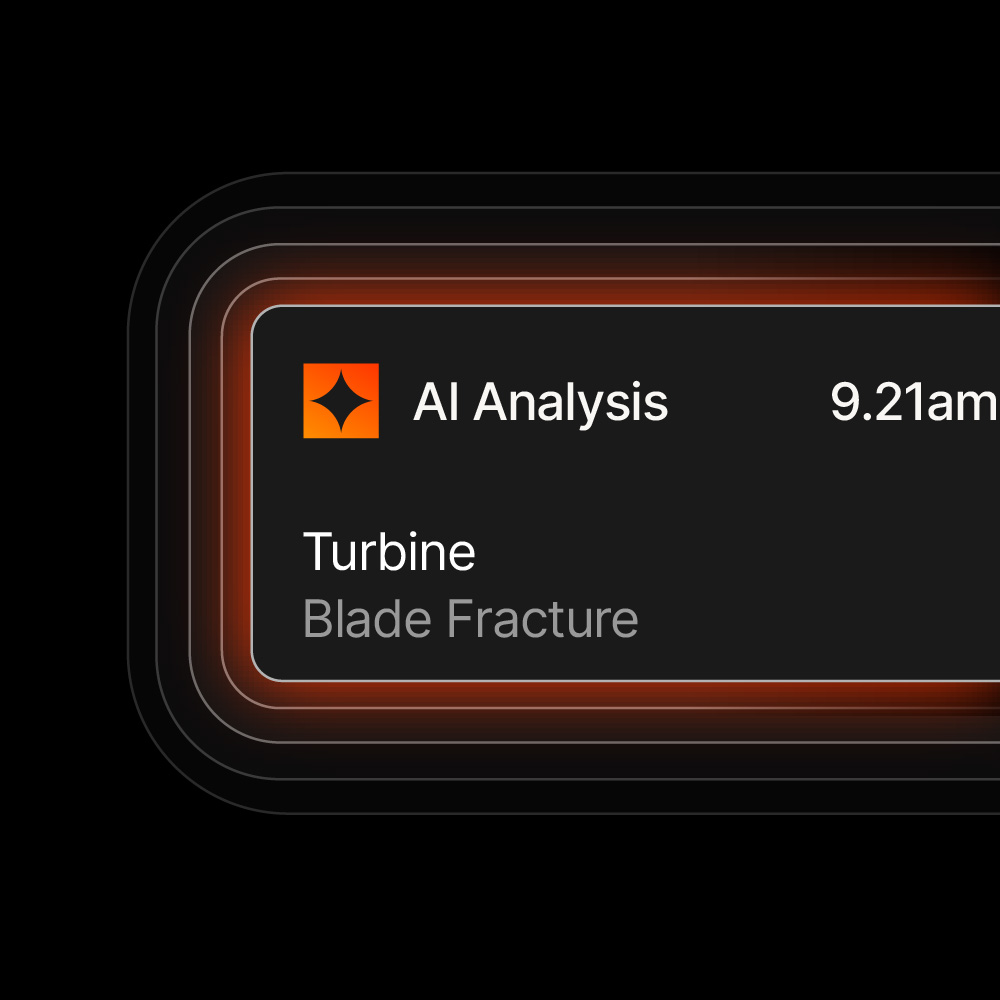
AI-Driven Insights
Cloud Dashboard
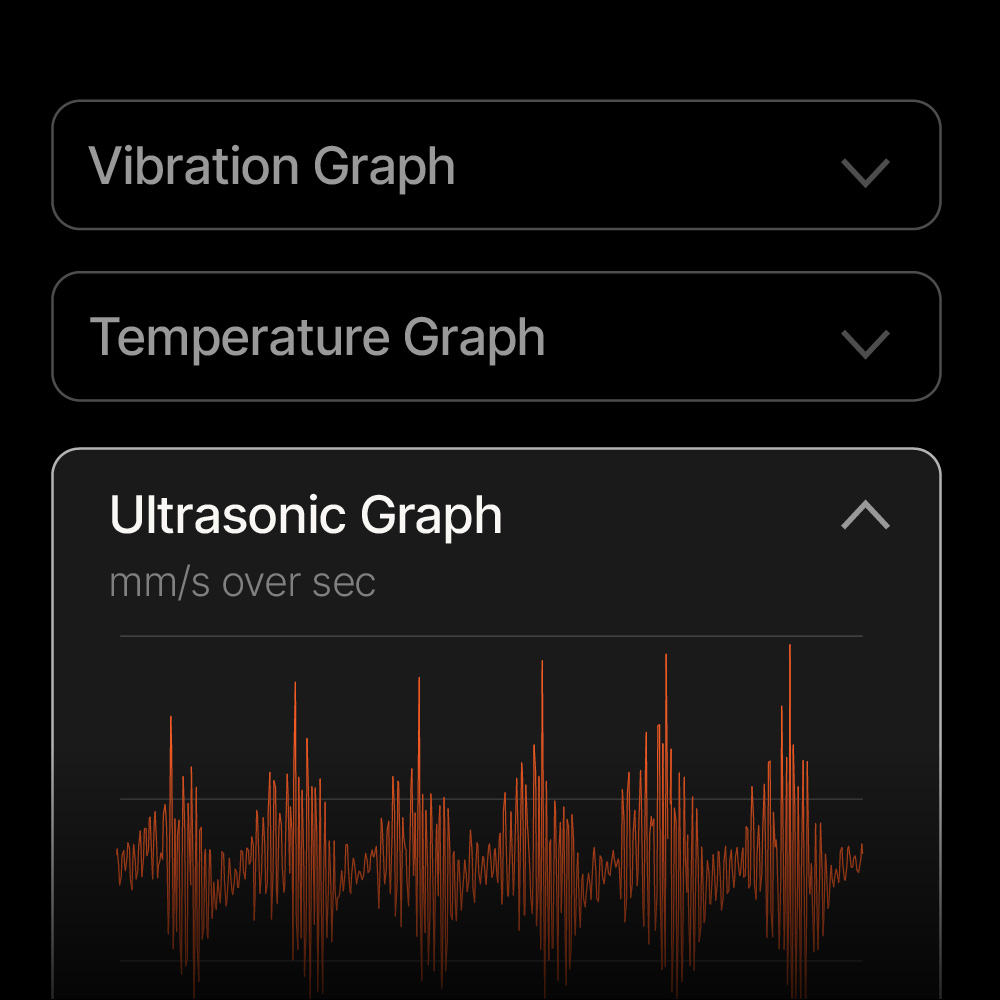
Real-Time Sensor Streaming
CloudDash ingests vibration, ultrasonic, temperature, and electrical readings instantly, displaying continuous machine behaviour with no delay. Users gain a live window into equipment performance, enabling fast reactions to abnormal patterns as they occur.
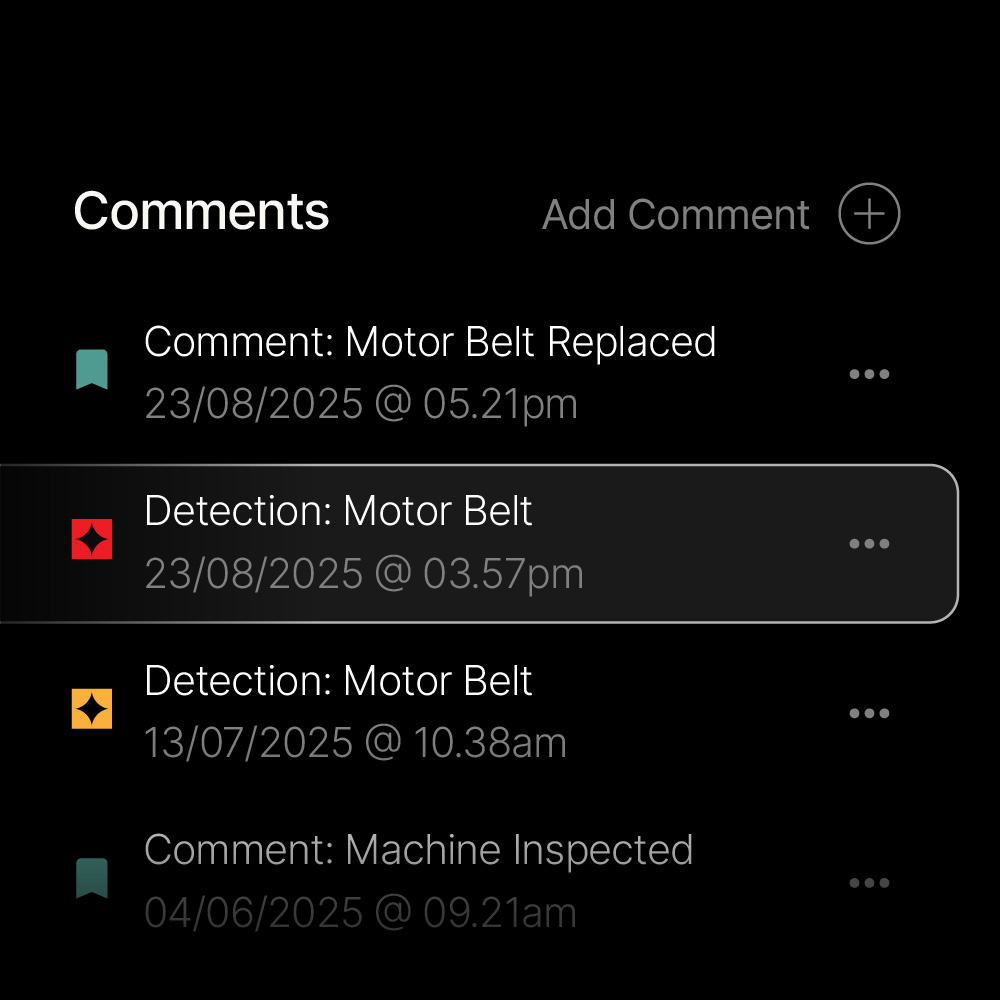
Instant Anomaly Alerts
The system detects sudden deviations in sensor data and sends immediate alerts to operators. These notifications highlight abnormal spikes, noise bursts, or temperature jumps, ensuring issues are seen and addressed the moment they emerge.
Facility-Level Segmentation
CloudDash organizes machines by area, floor, or full facility, giving teams a clear, structured view of where issues arise. This segmentation simplifies monitoring large sites, enabling quick identification of problem zones and targeted on-site response.
Custom Monitoring Dashboards
Teams create dashboards tailored to their machines, choosing specific sensors, thresholds, and visual layouts. This flexibility ensures operators see only the most important live metrics, reducing noise and improving response efficiency.
Key Features


Made for large teams and multiple locations

System Architecture
Secure cloud-native infrastructure
High-speed data ingestion
Low-latency edge-to-cloud syncing
Scalable multi-tenant backend
Encrypted data transmission
Monitoring & Analytics
Real-time machine diagnostics
Automated fault classification
Predictive maintenance modelling
Sensor fusion insights
Historical trend analysis
User & Management Tools
Customisable dashboards
Role-based access control
Automated alert workflows
API integration support
Scheduled reporting system